|
In a new paper, we used Google Trends to reveal the spatiotemporal patterns of US drought awareness. This paper has been published in Palgrave Communications (a Nature journal, now Humanities and Social Sciences Communications). Here is more information about this paper: Article Title: Spatiotemporal Patterns of US Drought Awareness Summary: Drought is a creeping climatological phenomenon with persistent precipitation deficits. The intangible and gradual characteristics of drought cause a lack of social response during the onset. The level of awareness of a local drought increases rapidly through mass media reports and online information searching activities when the drought reaches its peak severity. This high level of local drought awareness drives concerns for water shortage and support for water policy. However, spatiotemporal patterns of national-scale drought awareness have never been studied due to constraints imposed by time-consuming and costly survey data collection and surveys' limited sample sizes. Here, we present the national-scale study to reveal the spatiotemporal patterns of drought awareness over the contiguous United States (CONUS) using Google Trends data and an advanced statistical technique, Principal Component Analysis (PCA). Results show that the first two PC modes can explain 48% (38% for PC1 and 10% for PC2; see Figures below) of the total variance of state-level drought awareness. We find that the PC1 mode relates to a national pattern of drought awareness across the CONUS. The spatiotemporal patterns further imply that residents in the Northeastern US region are the most aware of the emergence of drought, regardless of the geographic location of the occurrence. The results illustrate how search engine queries and social media data can help develop an effective and efficient plan for drought mitigation in the future. The following Figure comes from Kim et al. (2019): 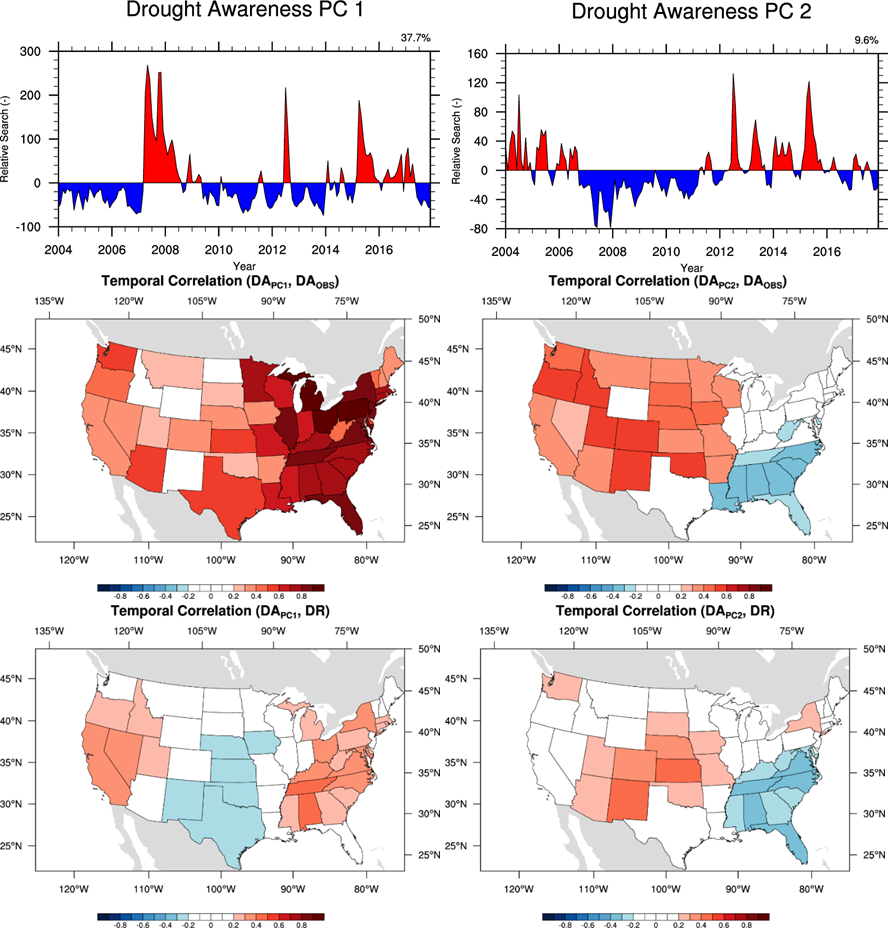 Figure 1: Major principle components of state-level drought awareness and state-level drought risk over the contiguous United States. Temporal correlations of Drought Awareness from the first two major modes with individual state-level drought awareness ((c) and (d), respectively) and individual state-level drought risk ((e) and (f), respectively). White colored states depict the states with insignificant temporal correlation at the 99% confident level. 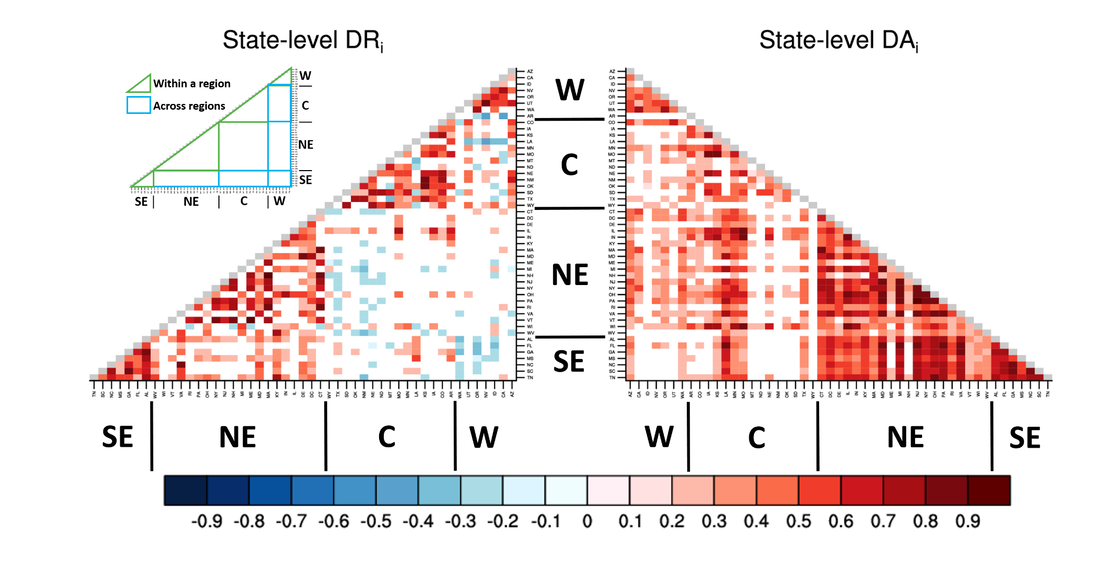 Figure 2: State-level correlation analysis of drought awareness and drought risk. Colors in the grid cells depict temporal correlation coefficients of state-level drought awareness (left triangle) and state-level drought risk (right triangle) of one state with those of the rest 48 states. To assist interpretation, areas that depict interstate relationships within the region (green colored boundaries) and across regions (blue colored boundaries) are shown in the legend box at upper-left corner.
1 Comment
6/28/2019 1 Comment A new paper in Disasters Our new paper was published in Disasters (impact factor: 1.797). Here is the abstract: "It is of significance to assess and depict community vulnerability to floods and hurricanes. Over the past several decades, flooding and hurricanes have affected millions of people and caused massive economic losses. Despite efforts to reduce risks, these natural hazards remain to be a considerable challenge to coastal communities. In this paper, Geographic Information Systems (GIS) methods are used to analyze coastal communities’ vulnerability to hurricanes and flooding along the U.S. Gulf coast, which is prone to these two hazards. Specifically, two types of quantitative indicators are developed: exposure to hurricanes and flooding, based on data from multiple sources such as National Climate Data Center and National Flood Insurance Program among others, and a social vulnerability index, constructed on census data at census tract level. These indices are combined to depict the spatial patterns of overall community vulnerability to flooding and hurricane hazards along the U.S. Gulf Coast. Results of this study can potentially inform disaster management agencies, county governments and municipalities of areas with heightened community vulnerabilities. The demonstration of geographic distribution of community vulnerability can assist decision makers in prioritizing to‐do items and designing policies/plans for more effective allocation of resources. We end this paper by discussing the limitations to the present study and the practical implications of the assessment." The following two figures are from this article (Shao et al. forthcoming). 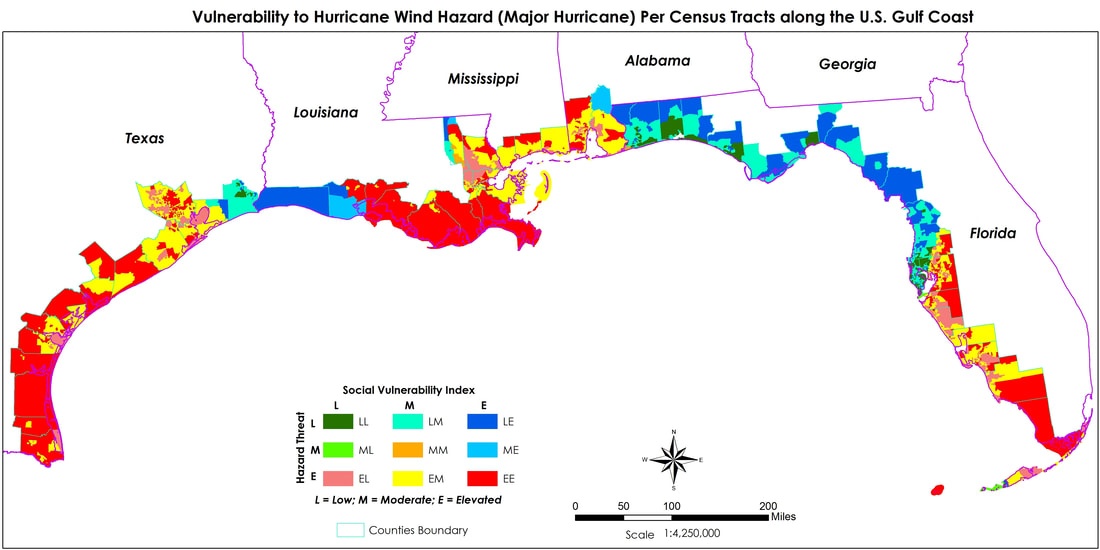 
Our paper on public support for flood mitigation was just published on Environmental Research Letters (impact factor: 6.192). Here is the abstract: "What is the decision-making mechanism people rely upon to mitigate flood risk? Applying Bayesian Network modelling to a comprehensive survey dataset for the U.S. Gulf Coast, we find that the overall support for flood mitigation can be inferred from flood insurance purchase behavior (i.e., without insurance vs. with insurance purchased mandatorily, voluntarily, or both). Therefore, we propose a theoretical decision-making mechanism composed of two dimensions including informed flood risk and sense of insecurity. The informed flood risk is the primary determinant on one's overall support for flood mitigation. Risk mitigation decisions are largely contingent on the level of risk that is effectively conveyed to individuals. Additionally, sense of insecurity plays a moderate role in determining individuals' overall support for flood mitigation. The sense of insecurity can move people toward overall support for mitigation, but the effect is not as large as the informed risk. Results of this study have fundamental policy implications. The flood risk informed by Federal Emergency Management Agency's flood maps not only provides the compulsory basis for flood insurance purchase but also determines individuals' overall support for flood mitigation. Flood map inaccuracy can immensely mislead individuals' overall risk mitigation decision. Meanwhile, this flood risk mitigation decision-making mechanism inferred from a survey data in the U.S. Gulf Coast needs to be tested and validated elsewhere." In this paper, we proposed a flood mitigation decision-making mechanism (please see below). One implication of this study is that "the importance of risk information in overall flood mitigation decisions. Although the flood premiums do not reflect real risks due to discounts, flood hazard zones have effectively conveyed the risk to homeowners. Risk signals can thus be delivered to homeowners through various means." 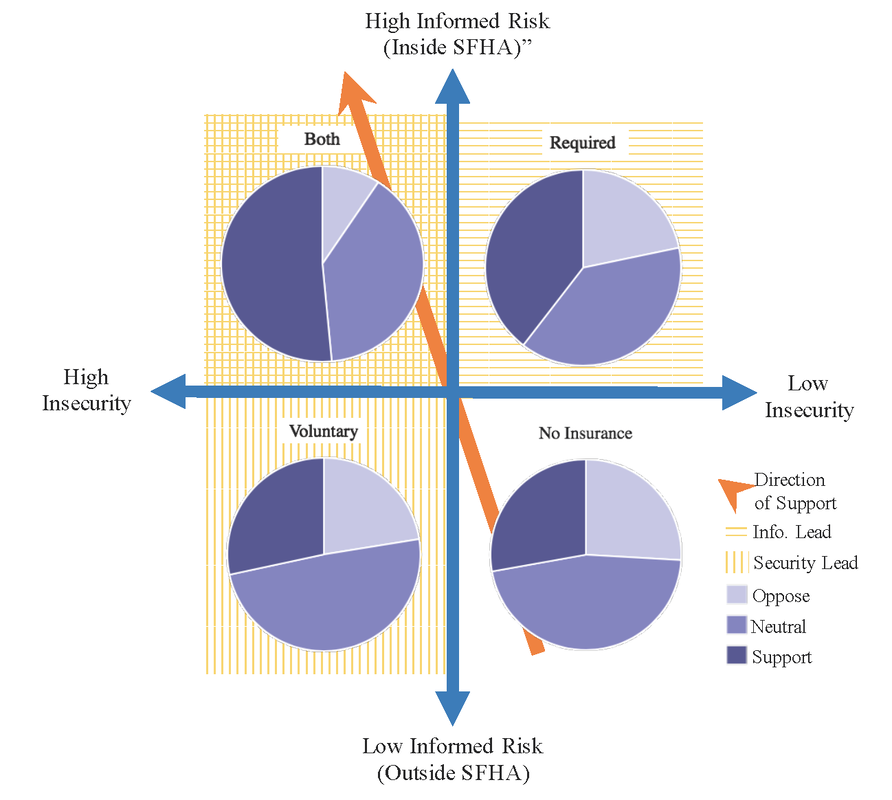 I am featured in the NYT article by Brad Plumer. In this article, he explored how the weather gets weaponized in climate change messaging.
2/23/2019 1 Comment Surveys from different sources show the uptick in public concern for climate change 2018 has brought a record number of extreme weather events, Hurricanes Florence and Michael and California wildfires being the most prominent ones. This led to a common speculation within the circles of scientists and mass media that these extreme weather events would drive up American public concern for climate change. Surveys conducted by the Yale Climate Change Communication Program with George Mason Center for Climate Change Communication show that there is a steady increase in the number of Americans who are most worried about climate change and supportive for aggressive actions to reduce carbon emission since 2013. Surveys conducted by the Pew Research Center for the People and the Press seem to reveal the same trend since 2013. 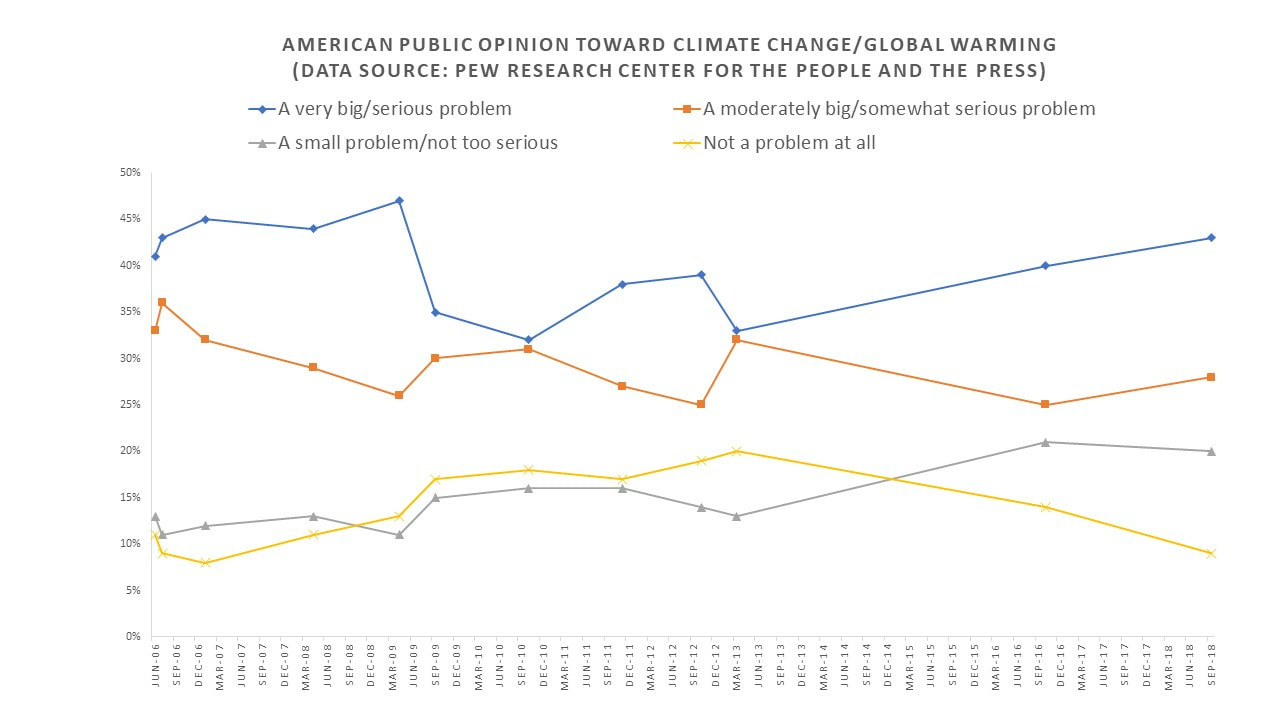 The 2019 Journey in Science series at Rodgers Library for Science & Engineering at the University of Alabama: I will give a lightening talk summarizing my past and recent research on the topic of American public opinion towards climate change. In this talk, I will discuss the various forces including both natural and socio-political ones that influence American opinion towards this critical issue.  12/21/2018 1 Comment Our new paper on flood perceptions Our new paper on how physical geography influences perceptions of flooding just got published online in the Journal of Hydrology (impact factor: 4.405). Here is the abstract of this paper:
"How does physical history of flood-related hazards affect individuals’ perceptions? The present study represents a unique effort to understand perceptions of flood hazards in light of the geographic background. Situated in Alabama, the United States, the cities of Mobile and Huntsville display two different physical geographic contexts. Despite one being a coastal city (Mobile) and the other being an inland city, both are similarly vulnerable to flooding. We first present results of historical analyses of heavy precipitation in both cities and analysis of storm surge history in the city of Mobile. We then report results of both descriptive statistical and inferential statistical analyses based on a two-city residents’ survey that was conducted in the spring of 2016. We find that residents in both cities are able to connect the particular natural hazard of flooding with their physical environments. Residents in both cities are influenced by their perceptions of precipitation when making assessments of flooding. Despite the fact that Huntsville has not experienced heavy precipitation events as much as Mobile in recent history, residents of Huntsville tend to link heavy rainfall – the most frequent cause of flooding in that city, with flooding. In contrast, residents of Mobile tend to link hurricanes, more particularly hurricane number, with flooding. These results show that people are attuned to their physical environments and take into consideration their personal observations when forming perceptions of natural hazards. More studies need to be conducted to further investigate the dynamics of physical exposure to hazards and risk perceptions in other geographic areas." I just published one analysis article on extreme weather and American public opinion towards climate change on the Monkey Cage in Washington Post . Here is one paragraph:
"Here is what is going on: The baseline probabilities of Democrats’ and Republicans’ perceptions of climate change and extreme weather are different. To illustrate, imagine that the probability that someone in Party A believes in human-made climate change may be 80 percent, while that probability for someone in Party B may be only 30 percent. What my research finds is that extreme weather events can change that baseline probability upward, regardless of partisanship or ideology. That change may be more dramatic for those in Party A than Party B. Nevertheless, the change does occur; extreme weather can move the needle." The recently released Fourth National Climate Assessment sends an urgent message to communities across the nation. Extreme weather events will intensify and become more frequent. The increasing intensity and frequency of extreme weather events will pose serious threats to communities, especially low-income and other marginalized communities. Although many local communities have displayed growing interest in elevating their resilience to the ever changing climatic conditions, much less interest has been shown in mitigating carbon emission as we have seen in the failures to pass carbon tax in even liberal states. Understandably, climate change being the ultimate tragedy of the commons, the benefit of reducing carbon emission is trivial compared to that of taking actions to adapt to climate change at the local level. However, this level of urgency and impact does demand regional and national cooperative framework.
The Department of Geography at the University of Alabama is accepting applications for a one-year research assistantship in political ecology with the possibility of renewal for the pursuit of a doctoral degree. The assistantship provides a stipend plus tuition remission.
The successful applicant will work with me and will be involved in political ecology projects focused on human dimension of climate change, community resilience to climatic hazards, environmental hazards and public health in the U.S. in general and the U.S. Gulf Coast in particular. Qualified candidates should have a Master’s degree in Geography, Environmental Studies/Sciences, Planning or a related discipline. Candidates should have a strong interest in the intersection of social, political, and physical dimensions of climate change and be eager to work in an interdisciplinary environment. Experience in quantitative data analysis and geographic information systems (GIS) are desired. Strong oral and written communication skills are required. For more information about this assistantship, please contact me at wshao1@ua.edu well in advance of February 15, 2019 (the application deadline). Please include a copy of your CV, unofficial academic transcripts, and a brief personal statement that highlights skills relevant to the position. For more information about the department, please see https://geography.ua.edu/. |

|

 RSS Feed