|
Our new paper, entitled "Public awareness and perceptions of drought: A case study of two cities of Alabama" is published in Risk, Hazards, & Crisis in Public Policy. Below please find the abstract:
"Drought poses serious risks to society. There is, however, a lack of timely public awareness and sufficient public risk perceptions of this hazard due to its gradual onset. Timely and adequate public response is conducive to effective mitigation. It is imperative to understand how the public responds to drought. Using data from multiple sources, situated in two cities (Mobile and Huntsville) of Alabama, our study represents a comprehensive effort to understand public awareness and perceptions of drought. We have made several important findings. First, both physical and social contexts can influence public awareness of drought. Mobile is prone to a variety of coastal hazards and displays high social vulnerability. Residents in this city are thus more sensitive to environmental shocks, especially less frequent ones such as drought. Second, public awareness of drought is not constrained within the immediate drought impact area. Governmental declaration or regulation can bring the issue of drought from one area to the attention of the other area within one state. Third, public perceptions of drought numbers are negatively correlated with perceptions of precipitation but positively associated with perceptions of extreme heat. This finding reflects that the public perception of drought is in line with scientific understanding of drought. Drought is by definition persistent deficit of precipitation. Flash droughts can be triggered by heat waves which are more likely to occur during a drought. We end this study with recommendations for future studies."
0 Comments
Our new paper has been published in Science of the Total Environment (Impact Factor: 7.963). Below please find the abstract: "Climate extremes will be intensified and become more frequent. One of the regions where this is the case is the U.S. Gulf coast region. This region is susceptible to the impacts of climate extremes. This region has recently experienced large amounts of economic damages caused by high-impact hurricanes and floods. Meanwhile, drought can also pose serious risks once it occurs. By using a 2019 U.S. Gulf Coast survey combined with Standard Precipitation Index, we closely examined retrospective and prospective evaluations of drought and flood among coastal residents. Drawing upon literature on human-environment system, we were interested in how the objective conditions of past drought and flood influenced individual’s perceptions of these hazards and how their retrospective evaluations were correlated with their prospective evaluations of future trends of these hazards. Coastal residents’ retrospective evaluations of past drought and flood were found to be influenced by historic objective conditions. Higher drought frequencies were found to increase the probability of perceiving increasing trend of drought number in the past. Higher flood frequencies were found to decrease the probability of perceiving increasing trend of flood number in the past. Higher intensities of drought and flood were found to increase the probabilities of perceiving increasing trends of drought duration and flood amount in the past. Coastal residents’ prospective evaluations of future drought and flood were found to be influenced by retrospective evaluations of these hazards, suggesting the temporal continuity in human judgement. Moreover, those who relied on a longer time span in reference to the future were found to be more likely to perceive increasing trends of drought and flood. We ended this paper by proposing a theoretical framework to guide future studies and discussing policy implications." 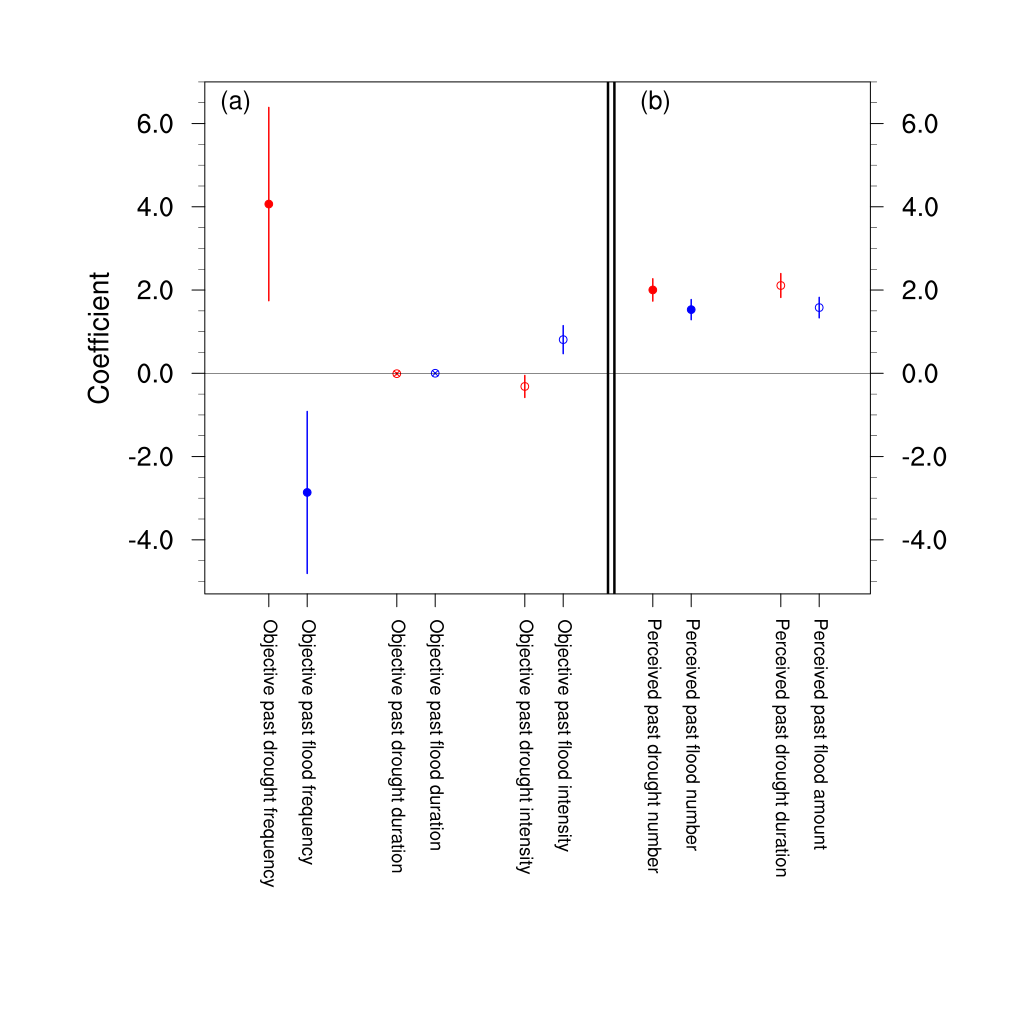 Core Figure - Figure 4. Retrospective evaluations of drought and flood risk and association with objective conditions (a) and their correlations with prospective evaluations of drought and flood risk (b). In (a), filled circles, circles with cross, empty circles depict the frequency, duration, intensity, respectively, of drought (red) and flood (blue). In (b) filled (empty) circles depict retrospective evaluations on past drought and flood numbers (past drought duration and past flood amount). The bars represent confidence intervals of all the estimated coefficients (Shao and Kam, 2020)  Graphic Abstract 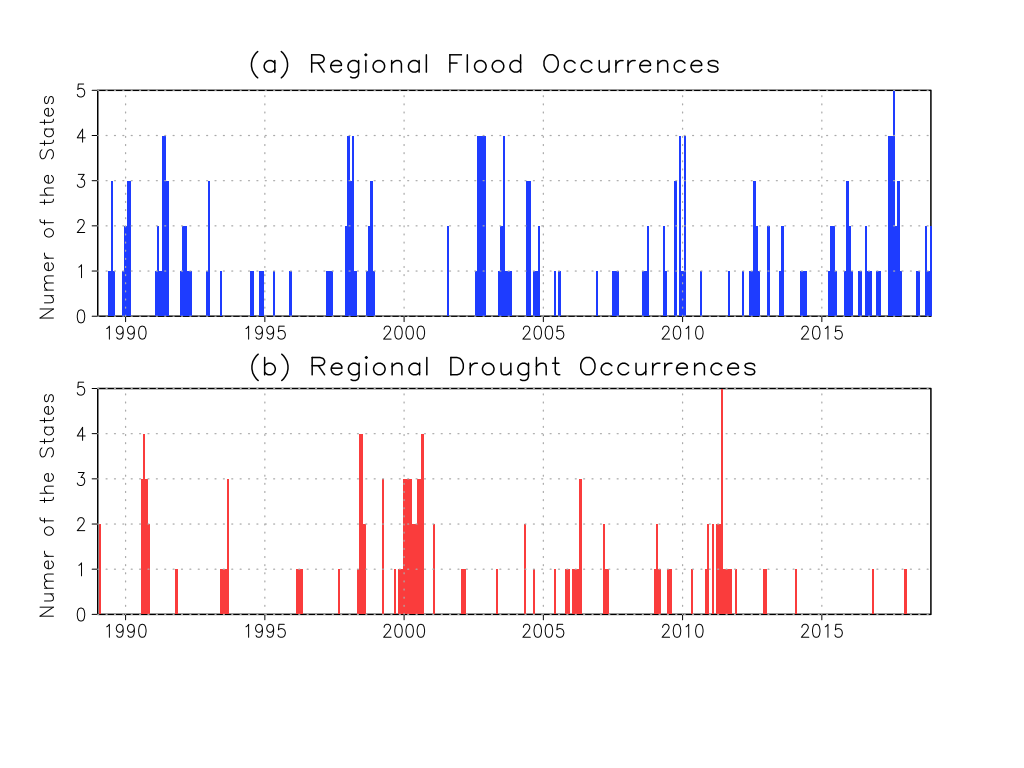 Figure 2. Number of states under regional drought events (red) and regional pluvial flood events (blue) (Shao and Kam, 2020)  Figure 3: Monthly time series of the relative search activity indices on drought (a) and flood (b) between 2004 through 2018. Dark (light) lines depict the averages (maximum and minimum values) of the relative search activity indices over the five Gulf costal states (Shao and Kam, 2020) In a new paper, we used Google Trends to reveal the spatiotemporal patterns of US drought awareness. This paper has been published in Palgrave Communications (a Nature journal, now Humanities and Social Sciences Communications). Here is more information about this paper: Article Title: Spatiotemporal Patterns of US Drought Awareness Summary: Drought is a creeping climatological phenomenon with persistent precipitation deficits. The intangible and gradual characteristics of drought cause a lack of social response during the onset. The level of awareness of a local drought increases rapidly through mass media reports and online information searching activities when the drought reaches its peak severity. This high level of local drought awareness drives concerns for water shortage and support for water policy. However, spatiotemporal patterns of national-scale drought awareness have never been studied due to constraints imposed by time-consuming and costly survey data collection and surveys' limited sample sizes. Here, we present the national-scale study to reveal the spatiotemporal patterns of drought awareness over the contiguous United States (CONUS) using Google Trends data and an advanced statistical technique, Principal Component Analysis (PCA). Results show that the first two PC modes can explain 48% (38% for PC1 and 10% for PC2; see Figures below) of the total variance of state-level drought awareness. We find that the PC1 mode relates to a national pattern of drought awareness across the CONUS. The spatiotemporal patterns further imply that residents in the Northeastern US region are the most aware of the emergence of drought, regardless of the geographic location of the occurrence. The results illustrate how search engine queries and social media data can help develop an effective and efficient plan for drought mitigation in the future. The following Figure comes from Kim et al. (2019): 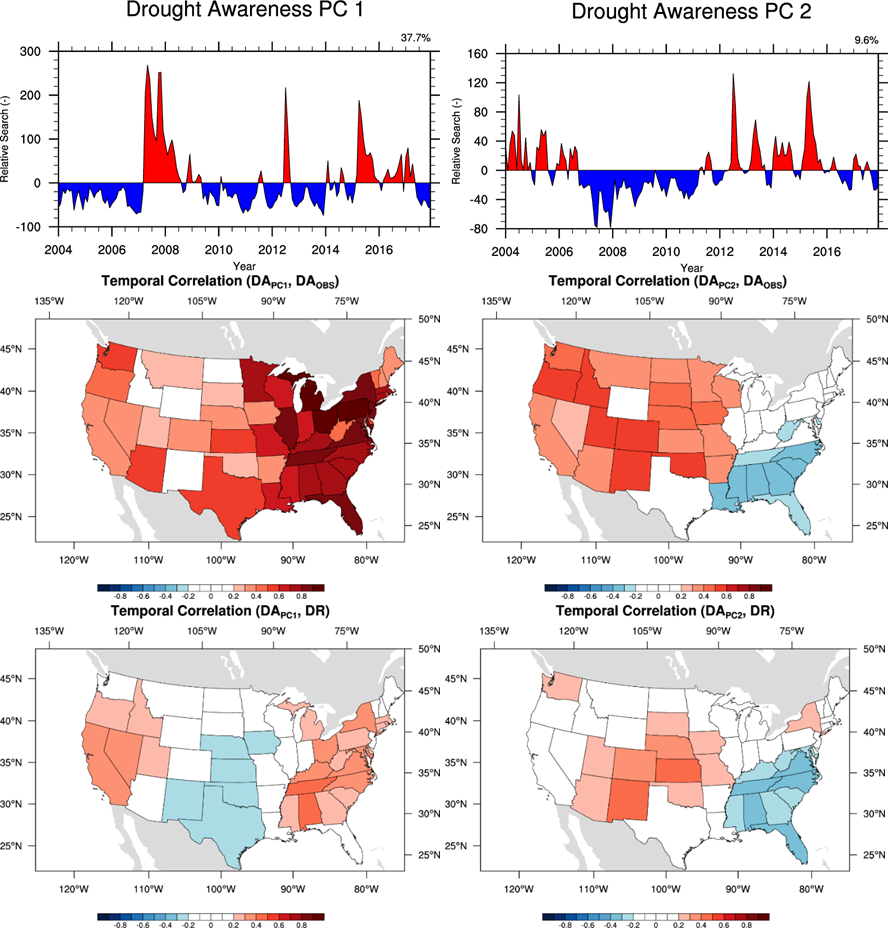 Figure 1: Major principle components of state-level drought awareness and state-level drought risk over the contiguous United States. Temporal correlations of Drought Awareness from the first two major modes with individual state-level drought awareness ((c) and (d), respectively) and individual state-level drought risk ((e) and (f), respectively). White colored states depict the states with insignificant temporal correlation at the 99% confident level. 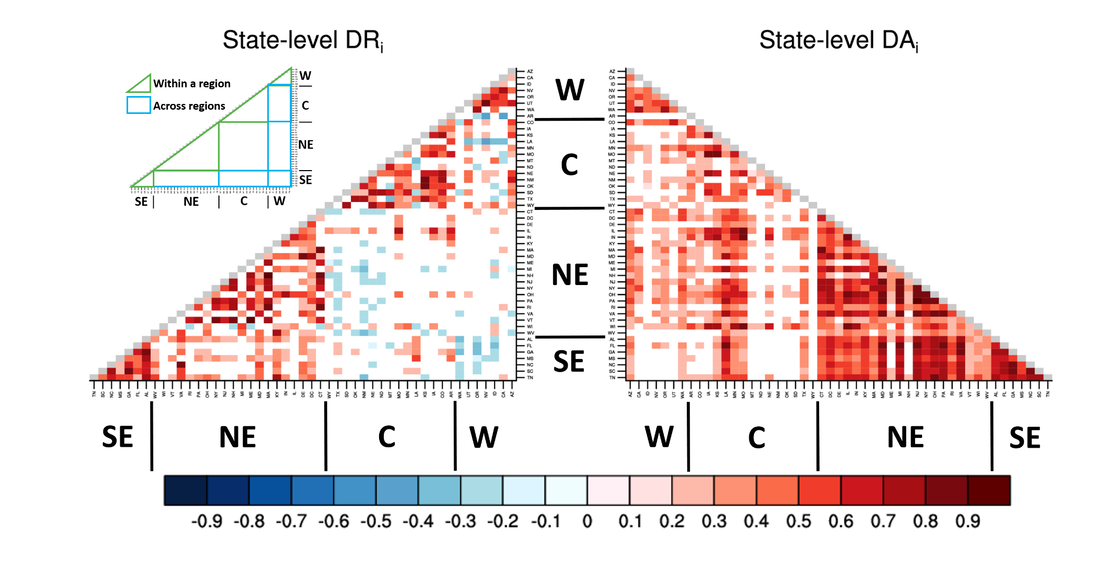 Figure 2: State-level correlation analysis of drought awareness and drought risk. Colors in the grid cells depict temporal correlation coefficients of state-level drought awareness (left triangle) and state-level drought risk (right triangle) of one state with those of the rest 48 states. To assist interpretation, areas that depict interstate relationships within the region (green colored boundaries) and across regions (blue colored boundaries) are shown in the legend box at upper-left corner.
|

|

 RSS Feed