|
Our paper entitled "Data-driven modeling reveals the Western dominance of global pubic interest in earthquakes" has been published in Humanities and Social Sciences Communications (Nature Springer journal). Below please find the abstract: "Catastrophic earthquakes stimulate information-seeking behaviors beyond the affected geographical boundaries; however, our understanding of the dynamics of global public interest in earthquakes remains limited. Herein, we harness big data to examine the dynamic patterns of global public interest, concerning 17 significant worldwide earthquakes over 2004–2019. We find that the global community shows a higher level of interest when an earthquake occurs in developed countries than in developing countries; however, they lose their interest in the former more rapidly than the latter. Regardless of the affected nation, there is a one- to two-week “golden” time window when attention can be leveraged for fundraising and humanitarian aid. Our findings suggest that European citizens who are highly interested in earthquakes emerge as a potential key community to achieve great inclusiveness in policy interventions to solicit international aid. The findings of this study hints how big data can be utilized to identify “time windows of opportunities” for international humanitarian organizations to efficiently raise donations, charities and aid resources around the world." 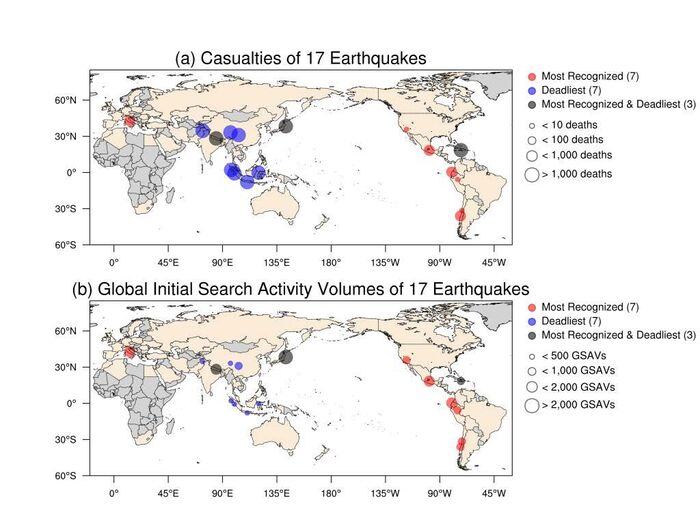 Fig. 1. Discrepancy between the top 10 deadliest and most recognized earthquakes since 2004: casualties (a) and initial global search activity volumes (GSAVs; (b)) of the 17 identified earthquakes. The size of circles in (a) and (b) represents the corresponding earthquake’s casualties and initial GSAVs. Black dots depict earthquakes in both categories (deadliest and most recognized). Blue and red dots depict the remainder of the deadliest and most recognized earthquakes, respectively. Areas colored in ivory depict the 62 nations that contribute to the daily GSAV data (Source: Kam et al. in press) 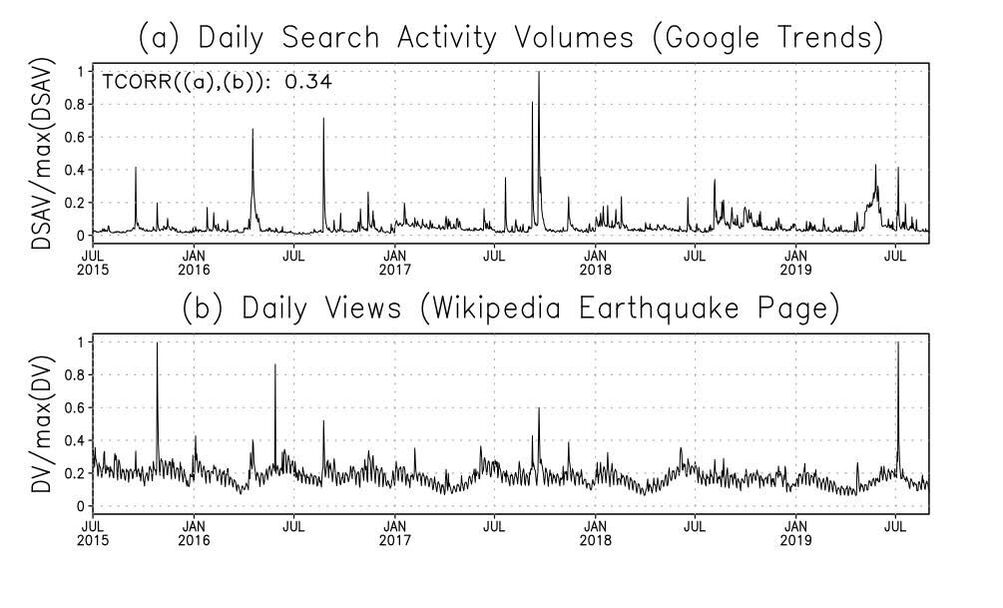 Fig. 2. Consistency between Google Trends and Wikipedia pageview data. Time series of daily GSAVs (a) and daily views of the Wikipedia “Earthquake” webpage (b) from July 2015– August 2019, which was retrieved on January 1, 2020. (Source: Kam et al. in press)
1 Comment
Our analysis article reflecting on the COVID-19 year was just published on the Conversation:
"Even though Americans shared the experience of living through a global pandemic, their individual attitudes towards it differed and evolved – sometimes dramatically... Overall, our research shows the combination of timely information with trusting, well-connected communities, is most likely to result in collective risk mitigation behavior. Perhaps these insights can help the U.S. prepare better for the next pandemic." Our paper entitled "Understanding American public support for COVID-19 risk mitigation: The role of political orientation, socio-demographic characteristics, personal concern, and experience" has been published the International Journal of Public Health (Impact factor: 3.38). Below please find the abstract:
"Objectives: COVID-19 is the most challenging public health crisis in decades in the United States. It is imperative to enforce social distancing rules before any safe and effective vaccines are widely available. Policies without public support are destined to fail. This study aims to reveal factors that determine the American public support for six mitigation measures (e.g., cancel gatherings, close schools, restrict non-essential travel). Methods: Based on a nationally representative survey, this study uses Structural Equation Modelling to reveal the relationships between various factors and public support for COVID-19 mitigation. Results: 1). Democrats are more likely than Republicans to support mitigation measures; 2).Favorability towards the political leader (Biden or Trump) can slant public support for COVID-19 mitigation measures among different segments of the public; 3). Indirect experience, rather than direct experience with COVID-19 can motivate people to support mitigation; 4). Concern for COVID-19 is a strong motivator of support for mitigation. Conclusion: Political polarization poses an enormous challenge to societal well-being during a pandemic. Indirect experience renders COVID-19 an imminent threat." Our new paper entitled "Understanding the effects of individual and state-level factors on American public response to COVID-19" has been accepted for publication in American Journal of Health Promotion (Impact factor: 2.87). Below please find the abstract: "Purpose: To examine multilevel predictors on American public response to COVID–19. Design: Multilevel study. Setting: A national survey was conducted by Qualtrics from August 24 to September 11, 2020. The state-level variables were constructed on data from multiple sources. Subjects: 2,440 respondents 18 years and older from all 50 states and D.C. Measures: The outcome variable is the public response to COVID–19 measured by threat perception, behavioral adjustment, and policy support. The predictors include individual-level sociodemographic factors and state-level indicators about public health conditions, political context, and economic recovery. Analysis: Multilevel structural equation modeling is used for statistical estimation. Results: People from states with more COVID–19 cases (β=0.020, p<0.1), mandatory face mask policies (β=0.069, p<0.05), and liberal governments (β=0.002, p<0.05) are more likely to respond while people from states whose economies have recovered closer to the pre-pandemic level are less likely to do so (β=-0.005, p<0.05). Regarding individual-level predictors, older people (β=0.005, p<0.001) and people with better education (β=0.029, p<0.01), leaning toward the Democrat Party (β=0.066, p<0.001) and liberal political ideology (β=0.094, p<0.001), and have stronger generalized trust (β=0.033, p<0.001) are more likely to respond than their counterparts. Conclusion: Differences in the public response to the pandemic stem from variations in individual characteristics and contextual factors of states where people live. These findings contribute to the rapidly growing literature and have implications for public health policies."  Figure 1. Multilevel Structural Equation Modeling Diagram (Hao and Shao 2021b) 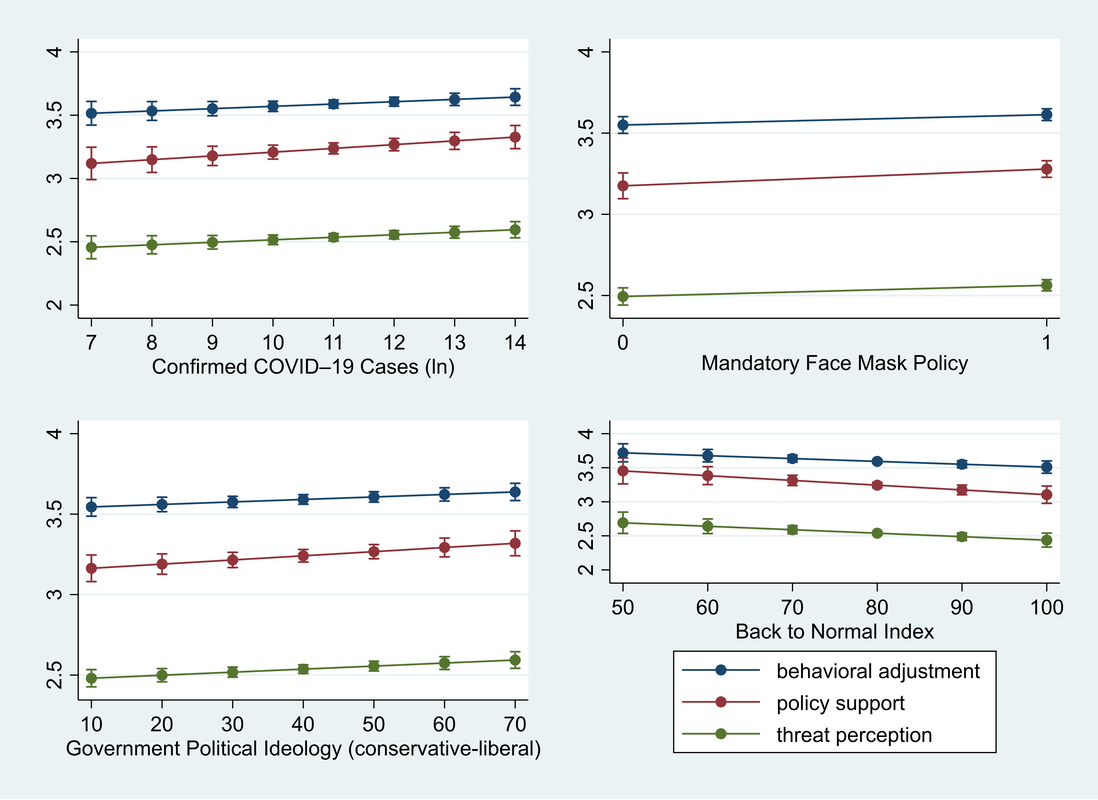 Figure 2. The Influence of State-Level Factors on Public Response to COVID–19 (Hao and Shao 2021b) 2/15/2021 0 Comments Our new paper in Health and Place Our new paper entitled "Understanding the influence of contextual factors and individual social capital on American public mask wearing in response to COVID-19" has been published in Health and Place (Impact Factor: 4.078) . Below please find the abstract: "The COVID–19 pandemic poses unprecedented risks to the health and well-being of the entire population in the U.S. To control the pandemic, it is imperative for individuals to take precautionary behaviors (e.g., wearing a mask, keeping social distance, washing hands frequently, etc.). The factors that influence individual behavioral response thus warrants a close examination. Using survey data for respondents from 10 states merged with state-level data, our study represents a pioneering effort to reveal contextual and individual social capital factors that explain public mask wearing in response to COVID–19. Findings of logistic multilevel regression show that the COVID–19 death rate and political control of government at the state level along with one’s social capital at the individual level altogether influence whether people decide to wear face masks. These findings contribute to the rapidly growing literature and have policy implications for mitigating the pandemic’s devastating impact on the American public." 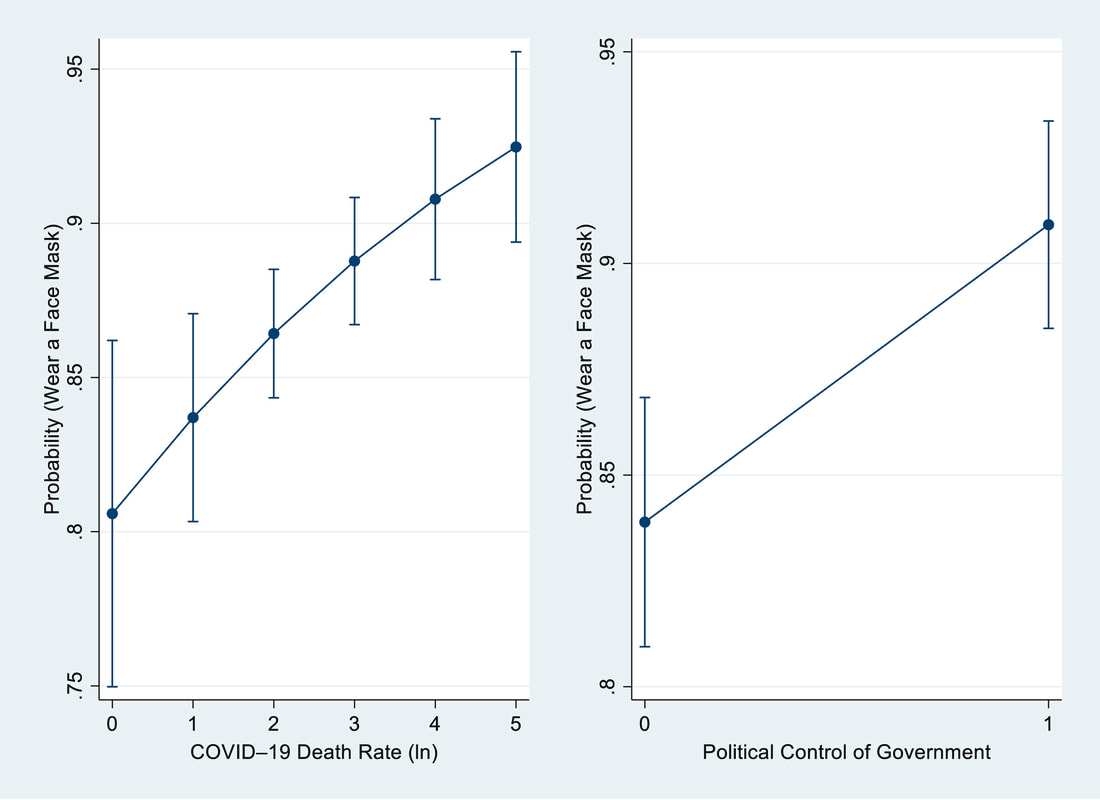 Fig. 2. Estimated Odds of Wearing a Face Mask predicted by State-Level COVID–19 Death Rate and Political Control of Government (Hao et al. 2021) 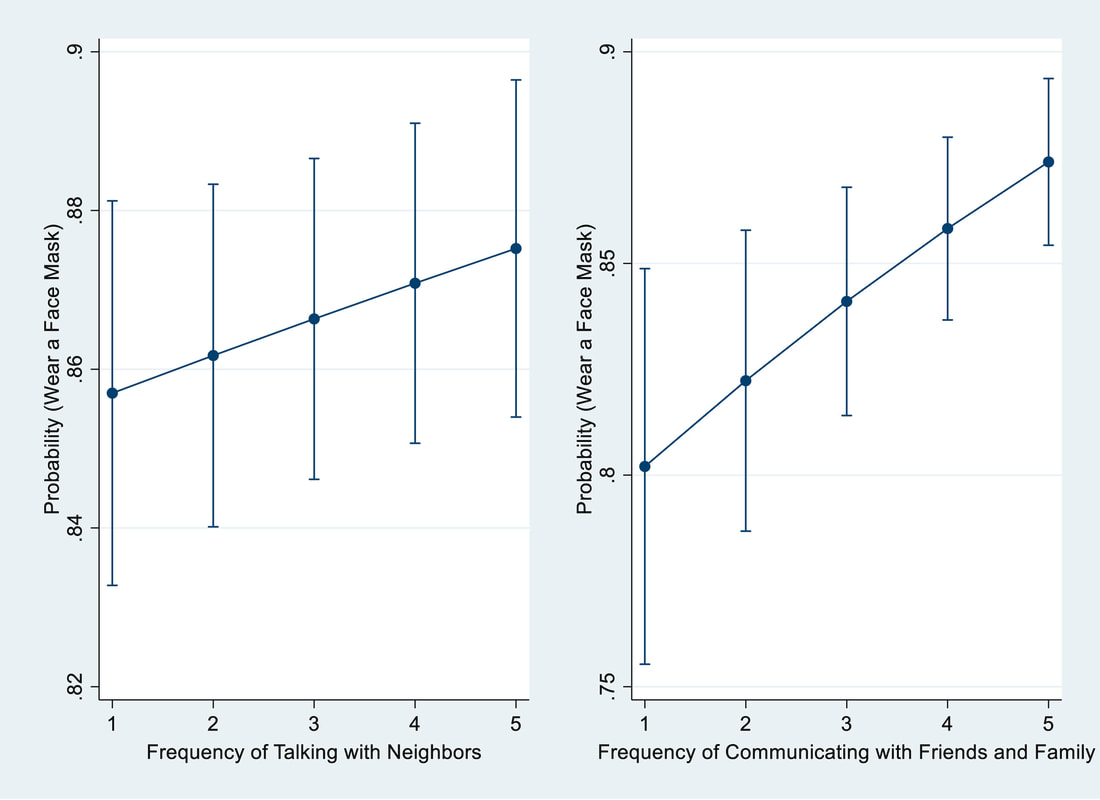 Fig. 3. Estimated Odds of Wearing a Face Mask predicted by Social Capital Indicators (Hao et al. 2021). Our new paper has been published in Energy Research & Social Science (Impact factor: 6.834). Below please find the abstract:
"Climate change poses unprecedented risks to human society. Ample scientific evidence suggests that greenhouse gas emissions are the primary contributor to climate change. Large-scale greenhouse gas emissions are mainly caused by the consumption of fossil fuels. Thus, promoting renewable energy is one key strategy to mitigate these emissions and combat climate change. In this study, we investigate some potential driving forces of renewable energy deployment. We analyze panel data for 118 countries worldwide from 1995 to 2015. Results show that countries that are more vulnerable to climate change and have less carbon-intensive economies consume higher shares of renewable energy in their total energy consumption. We have explained the effects of the carbon tax even though its influence is statistically insignificant. Thus, this study complements the literature by identifying the impact of these three factors on renewable energy deployment. The findings also imply that countries would become more supportive of renewable energy when their economy is less intertwined with fossil fuels and there are relevant policies that offer incentives on renewables." 10/13/2020 1 Comment My analysis article on the Conversation I just published one analysis article on the Conversation. Below please find the last section:
"Hope for shrinking the power of misinformation The success of slowing the spread of COVID-19 hinges largely on people taking precautions, particularly wearing face masks and social distancing, until a safe and effective vaccine is widely available. One study on attitudes toward climate change offers some hope. It found that a large number of Republicans and conservatives actually hold more unstable views about climate change over time. This instability may mean they could be more open to listening to the evidence and changing their minds. If this is also the case with COVID-19, strategic science communications and community engagement activities may be able to make a difference and stop the rising death toll." Our new paper on perceptions of sea level rise has been published in Climatic Change (Impact factor: 4.743). Below please find the abstract: "Sea level rise (SLR) in the 21st century poses fundamental risks to coastal residents. The U.S. Gulf of Mexico Coast (Gulf Coast) is among the regions experiencing the most rapid relative SLR. Beyond its increasing exposure to SLR and related coastal flooding, the Gulf Coast is home to a large population and displays high social vulnerability. How the coastal population in this vulnerable region perceives the impending risks posed by SLR warrants further examination. Do coastal residents’ perceptions of SLR conform to the scientific projections? We adopt an integrative approach based on a 2019 survey merged with contextual data including percentage of population living within the Special Flood Hazard Area (SFHA) and social vulnerability at the county level, both of which are extracted from the Centers for Disease Control and Prevention. We find that public risk perceptions of sea level change are influenced by political predisposition, with Republicans being less likely than Democrats to expect SLR in the future. Moreover, SLR remains temporally distant issue among coastal residents. We then directly compare public expectations and scientific estimations of SLR in five states of the U.S. Gulf Coast region and find that coastal residents in states that have experienced faster SLR in the past are more optimistic about future SLR by underestimating its magnitude compared to those experiencing slower SLR. Moreover, we find that people likely conflate the severity with likelihood of SLR risk. The contextual force represented by percentage of population living within the SFHA designated by the Federal Emergency Management Agency (FEMA) can significantly influence individuals’ estimations of future SLR, with higher percentages leading to higher estimates. We suspect that the SFHA has become a powerful risk communication tool that influences coastal residents’ judgments about future risk. 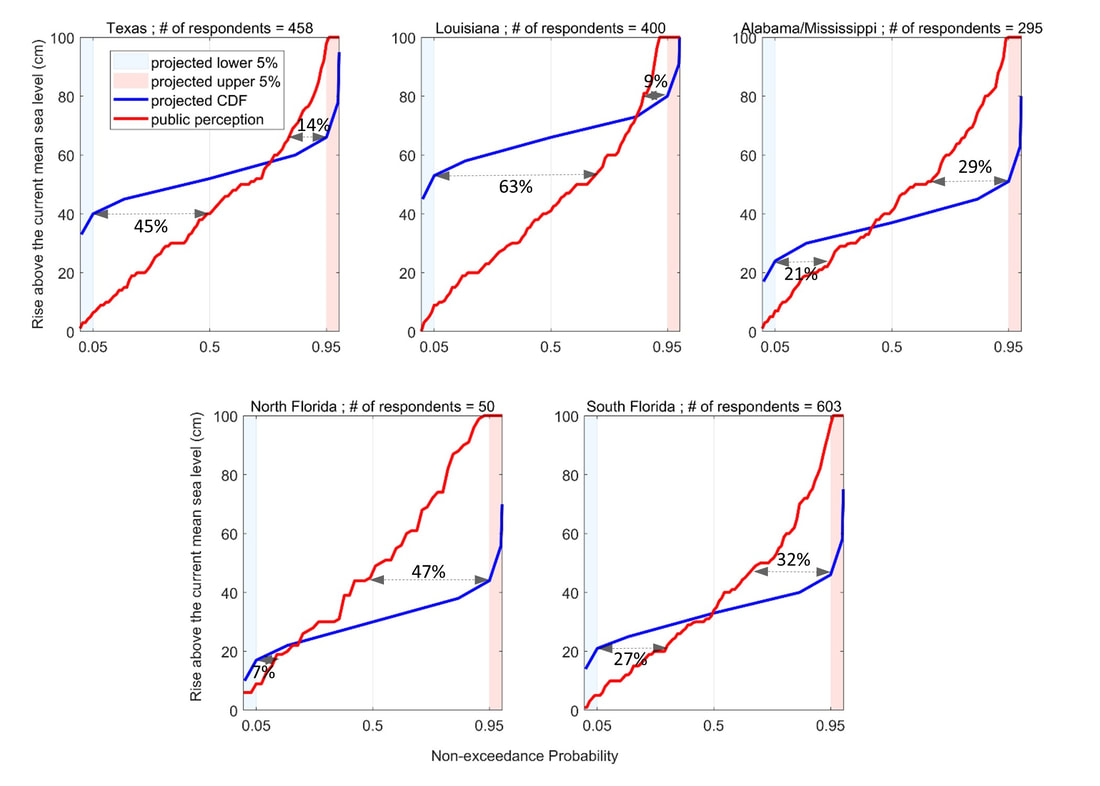 Figure 3. Comparison of public estimation with scientific estimation of SLR at five locations in Texas, Louisiana, Mississippi and Alabama, Florida Panhandle, and Florida Peninsula along the U.S. Gulf Coast. Percentages assigned at lower level and upper level in each figures represent percentages of respondents who estimated future SLR to be lower than the 5th and higher than the 95th scientific estimates, respectively (Source: Shao et al. in press). our new paper has been published in Climate Policy (impact factor: 5.085). Below please find the abstract: "Floods increasingly threaten disadvantaged communities around the globe. When limited financial resources are available, nature-based and community-based incremental adaptation that codifies existing actions and behaviors can help protect people and assets through risk reduction management. These adaptation measures mainly rely on non-financial capital that can be appropriate alternatives when financial resources are limited, especially within the context of disadvantaged communities. There are, however, challenges in implementing such adaptation measures, including differential power relationships that might lead to misallocation of benefits. We propose a polycentric governance framework that can enhance stakeholder engagement and mobilize various forms of non-financial capital to trigger a web of incremental adaptation measures through four support mechanisms: technological investment, institutional enhancement, knowledge production, and environmental protection. We further discuss how various facilitating factors, including i) communication and transportation infrastructure, ii) flexible laws/regulations, iii) risk communication, and iv) environmental restoration, can increase the likelihood of success in application of the framework. A successful application of the proposed framework also necessitates development of a research agenda around suitable non-financial metrics for monitoring and evaluating the performance of the proposed strategies. In addition, learning from new developments in general societal protection and resilience in communities with relatively large financial capital and experiences of practicing polycentric governance in disadvantaged communities may facilitate the implementation of polycentric governance-based disaster risk reduction globally." 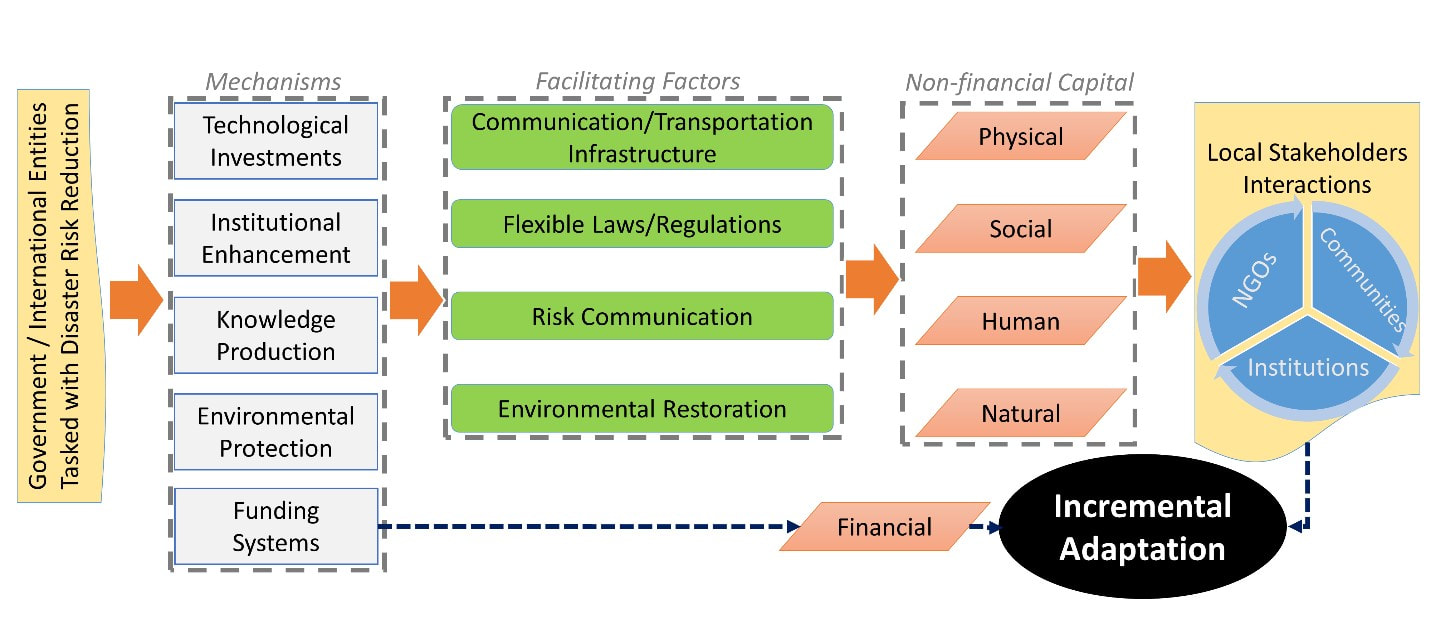 Figure 1: The proposed polycentric governance framework for incremental adaptation for disaster risk reduction. (Source: Moftakhari et al. in press) 10/1/2020 2 Comments A Ph.D opportunity My research group Environmental Decision Making at the Department of Geography at the University of Alabama is accepting applications for a Ph.D student with research assistantship, in social dimension of hazards in general and flood hazards in particular. The assistantship provides a stipend plus tuition remission.
The successful applicant will work with me and two research groups at the Department of Civil, Construction, and Environmental Engineering and will be involved in projects focused on human dimension of flood hazards. Qualified candidates should have a Master’s degree in Geography, Environmental Studies/Sciences, Planning or a related discipline. Candidates should have a strong interest in the intersection of social and physical dimensions of hazards and be eager to work in an interdisciplinary environment. Experience in quantitative data analysis, survey design, geographic information systems (GIS) are desired. Strong oral and written communication skills are required. For more information about this assistantship, please contact me at wshao1@ua.edu well in advance of February 15, 2021 (the application deadline). Please include a copy of your CV, unofficial academic transcripts, and a brief personal statement that highlights skills relevant to the position. For more information about the department, please see https://geography.ua.edu/. |

|

 RSS Feed