|
Our new paper, entitled "Public awareness and perceptions of drought: A case study of two cities of Alabama" is published in Risk, Hazards, & Crisis in Public Policy. Below please find the abstract:
"Drought poses serious risks to society. There is, however, a lack of timely public awareness and sufficient public risk perceptions of this hazard due to its gradual onset. Timely and adequate public response is conducive to effective mitigation. It is imperative to understand how the public responds to drought. Using data from multiple sources, situated in two cities (Mobile and Huntsville) of Alabama, our study represents a comprehensive effort to understand public awareness and perceptions of drought. We have made several important findings. First, both physical and social contexts can influence public awareness of drought. Mobile is prone to a variety of coastal hazards and displays high social vulnerability. Residents in this city are thus more sensitive to environmental shocks, especially less frequent ones such as drought. Second, public awareness of drought is not constrained within the immediate drought impact area. Governmental declaration or regulation can bring the issue of drought from one area to the attention of the other area within one state. Third, public perceptions of drought numbers are negatively correlated with perceptions of precipitation but positively associated with perceptions of extreme heat. This finding reflects that the public perception of drought is in line with scientific understanding of drought. Drought is by definition persistent deficit of precipitation. Flash droughts can be triggered by heat waves which are more likely to occur during a drought. We end this study with recommendations for future studies."
0 Comments
Our new paper is published online in Sustainable Cities and Society (impact factor: 7.587). Below please find the abstract: "The use of social media platforms such as Twitter significantly increases during natural hazards. With the emergence of several social media platforms over the past decade, many studies have investigated the applications of these platforms during calamities. This study presents a comprehensive spatiotemporal analysis of textual content from millions of tweets shared on Twitter during Hurricane Harvey (2017) across several affected counties in southeast Texas. We propose a new Hazard Risk Awareness (HRA) Index, which considers multiple factors, including the number of tweets, population, internet use rate, and natural hazard characteristics per geographic location. We then map the HRA Index across southeast Texas. Utilizing a dataset of 18 million tweets, we employ Natural Language Processing (NLP) along with a set of statistical techniques to perform analysis on the textual data generated by Twitter users during Hurricane Harvey. This enables us to subdivide the tweet contents into several categories per county that would inform crisis management during the event. In all, our study provides valuable information at the county level before, during, and after Harvey that could significantly help disaster managers and responders to minimize the consequences of the event and improve the preparedness of the residents for it. Since HRA is derived based on the meteorological observations and some demographic information, depending on the availability of such dataset and the nature of the hazard (i.e., flood, wildfire, hurricane, and earthquake), this index can be calculated and employed for assessing the risk awareness of a community exposed to either of these natural hazards." 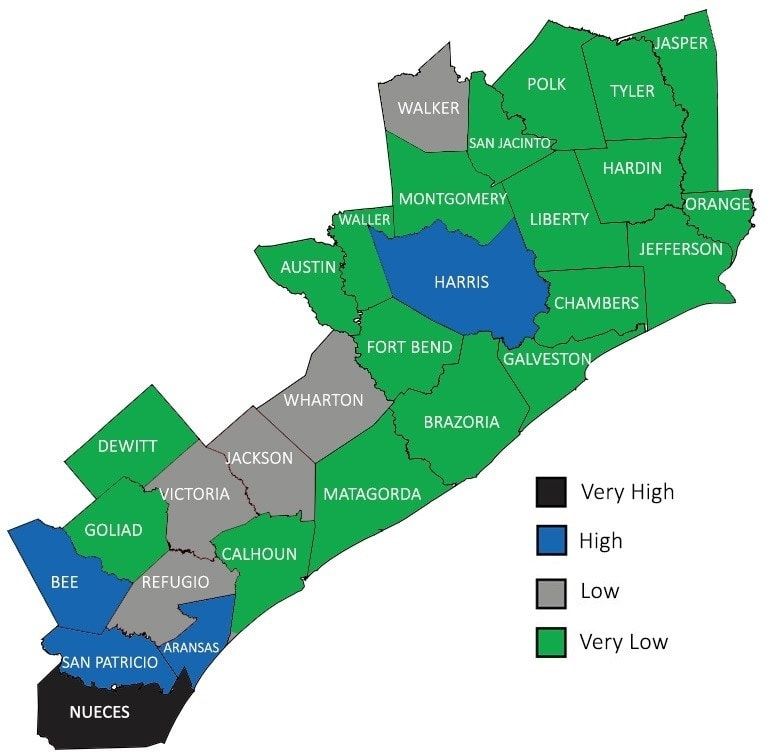 Figure 4. Hazard Risk Awareness index across the counties in southeast Texas affected by hurricane Harvey (Source: Karimiziarani et al. 2022) 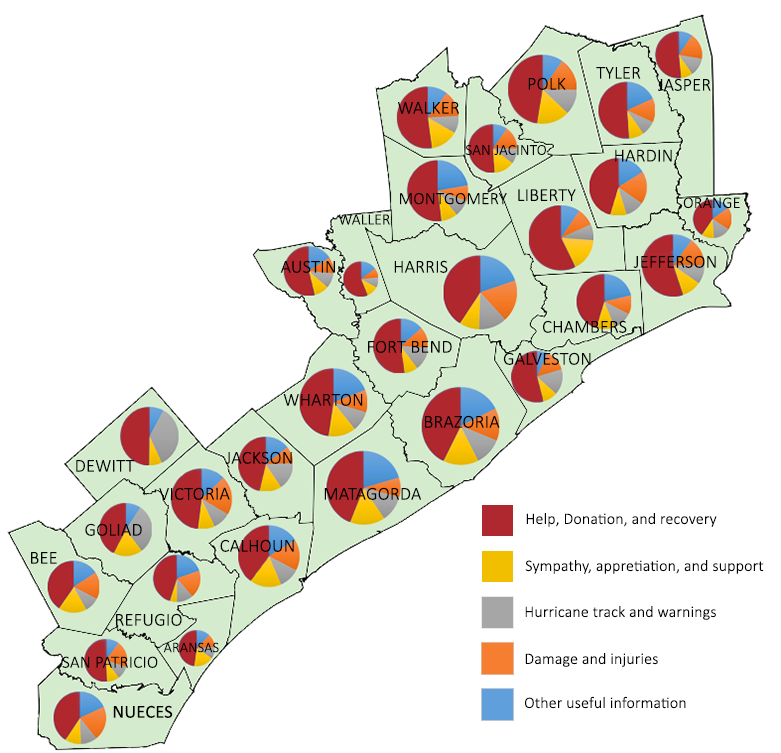 Figure 6. Categorized tweets into humanitarian classes across the counties affected by Hurricane Harvey (Source: Karimiziarani et al. 2022) Our new paper, entitled "Perceptions of earthquake risks and knowledge about earthquake response among movement challenged persons in Dhaka City of Bangladesh, has been published in the International Journal of Disaster Risk Reduction (impact factor: 4.32). Below please find the abstract:
"Dhaka, Bangladesh is one Asian city that is at high risk of earthquakes. Persons with physical disabilities, particularly movement challenged persons (MCPs), is highly vulnerable to earthquakes because of their mobility impairment. This study aims to explore risk perceptions of earthquakes and knowledge about response to earthquakes among MCPs in Dhaka through a 2020 survey of 455 respondents. Four risk perception measures are developed: perceived probability of an earthquake, fear, perceived threat to life, and perceived damage to property in the event of an earthquake. Subsequent factor analysis reveals that these four measures are loaded on one factor named risk perception. Measures of knowledge about response to earthquakes include knowledge of where to seek shelter while being inside and outside of home during an earthquake, location of critical facilities and existence of evacuation route in the locality as well as their knowledge about National Plan for Disaster Management (NPDM) of Bangladesh. This study finds that mobility aid, age, income, education, building structure, previous experience with earthquake are significantly related to risk perceptions. MCPs who have participated in the training know what they should do in the event of an earthquake irrespective of being outside or inside of home. MCPs with more education are more likely to know about NPDM and the existence of fault lines in Bangladesh. Lack of accessibility in training centers and lack of dissemination of information about training are key reasons behind MCPs not participating in the training." Our paper entitled "Data-driven modeling reveals the Western dominance of global pubic interest in earthquakes" has been published in Humanities and Social Sciences Communications (Nature Springer journal). Below please find the abstract: "Catastrophic earthquakes stimulate information-seeking behaviors beyond the affected geographical boundaries; however, our understanding of the dynamics of global public interest in earthquakes remains limited. Herein, we harness big data to examine the dynamic patterns of global public interest, concerning 17 significant worldwide earthquakes over 2004–2019. We find that the global community shows a higher level of interest when an earthquake occurs in developed countries than in developing countries; however, they lose their interest in the former more rapidly than the latter. Regardless of the affected nation, there is a one- to two-week “golden” time window when attention can be leveraged for fundraising and humanitarian aid. Our findings suggest that European citizens who are highly interested in earthquakes emerge as a potential key community to achieve great inclusiveness in policy interventions to solicit international aid. The findings of this study hints how big data can be utilized to identify “time windows of opportunities” for international humanitarian organizations to efficiently raise donations, charities and aid resources around the world." 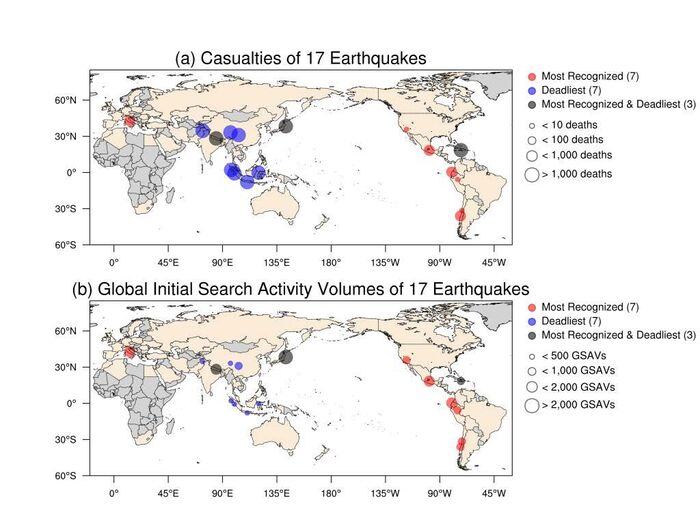 Fig. 1. Discrepancy between the top 10 deadliest and most recognized earthquakes since 2004: casualties (a) and initial global search activity volumes (GSAVs; (b)) of the 17 identified earthquakes. The size of circles in (a) and (b) represents the corresponding earthquake’s casualties and initial GSAVs. Black dots depict earthquakes in both categories (deadliest and most recognized). Blue and red dots depict the remainder of the deadliest and most recognized earthquakes, respectively. Areas colored in ivory depict the 62 nations that contribute to the daily GSAV data (Source: Kam et al. in press) 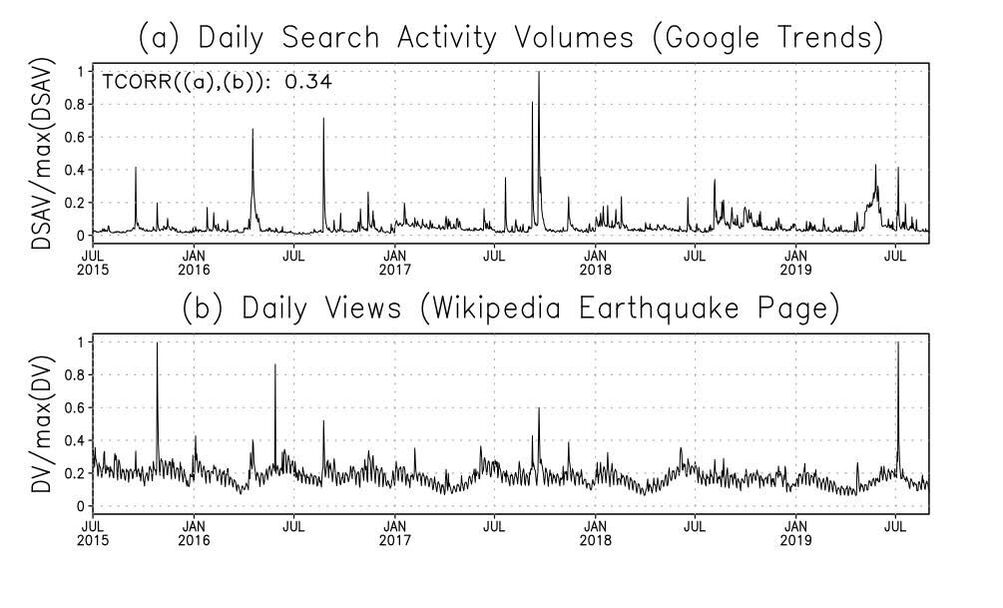 Fig. 2. Consistency between Google Trends and Wikipedia pageview data. Time series of daily GSAVs (a) and daily views of the Wikipedia “Earthquake” webpage (b) from July 2015– August 2019, which was retrieved on January 1, 2020. (Source: Kam et al. in press) our new paper has been published in Climate Policy (impact factor: 5.085). Below please find the abstract: "Floods increasingly threaten disadvantaged communities around the globe. When limited financial resources are available, nature-based and community-based incremental adaptation that codifies existing actions and behaviors can help protect people and assets through risk reduction management. These adaptation measures mainly rely on non-financial capital that can be appropriate alternatives when financial resources are limited, especially within the context of disadvantaged communities. There are, however, challenges in implementing such adaptation measures, including differential power relationships that might lead to misallocation of benefits. We propose a polycentric governance framework that can enhance stakeholder engagement and mobilize various forms of non-financial capital to trigger a web of incremental adaptation measures through four support mechanisms: technological investment, institutional enhancement, knowledge production, and environmental protection. We further discuss how various facilitating factors, including i) communication and transportation infrastructure, ii) flexible laws/regulations, iii) risk communication, and iv) environmental restoration, can increase the likelihood of success in application of the framework. A successful application of the proposed framework also necessitates development of a research agenda around suitable non-financial metrics for monitoring and evaluating the performance of the proposed strategies. In addition, learning from new developments in general societal protection and resilience in communities with relatively large financial capital and experiences of practicing polycentric governance in disadvantaged communities may facilitate the implementation of polycentric governance-based disaster risk reduction globally." 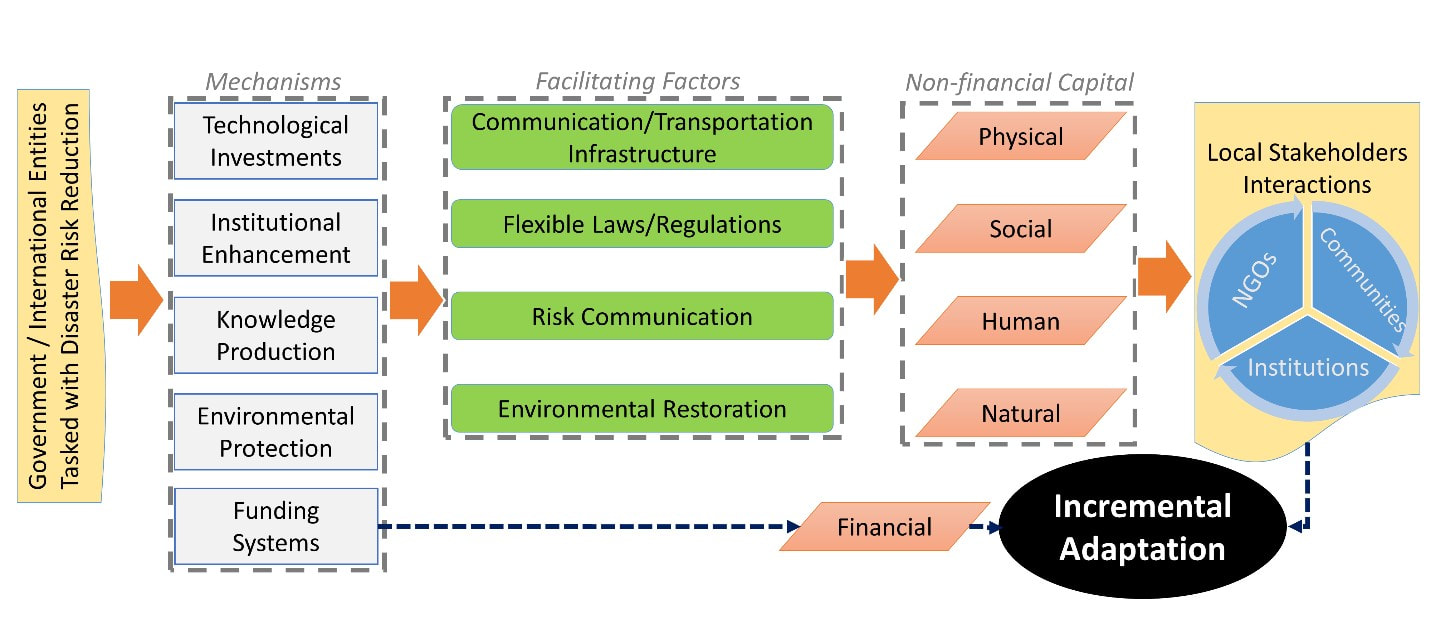 Figure 1: The proposed polycentric governance framework for incremental adaptation for disaster risk reduction. (Source: Moftakhari et al. in press) 10/1/2020 2 Comments A Ph.D opportunity My research group Environmental Decision Making at the Department of Geography at the University of Alabama is accepting applications for a Ph.D student with research assistantship, in social dimension of hazards in general and flood hazards in particular. The assistantship provides a stipend plus tuition remission.
The successful applicant will work with me and two research groups at the Department of Civil, Construction, and Environmental Engineering and will be involved in projects focused on human dimension of flood hazards. Qualified candidates should have a Master’s degree in Geography, Environmental Studies/Sciences, Planning or a related discipline. Candidates should have a strong interest in the intersection of social and physical dimensions of hazards and be eager to work in an interdisciplinary environment. Experience in quantitative data analysis, survey design, geographic information systems (GIS) are desired. Strong oral and written communication skills are required. For more information about this assistantship, please contact me at wshao1@ua.edu well in advance of February 15, 2021 (the application deadline). Please include a copy of your CV, unofficial academic transcripts, and a brief personal statement that highlights skills relevant to the position. For more information about the department, please see https://geography.ua.edu/. Our new paper has been published in Science of the Total Environment (Impact Factor: 7.963). Below please find the abstract: "Climate extremes will be intensified and become more frequent. One of the regions where this is the case is the U.S. Gulf coast region. This region is susceptible to the impacts of climate extremes. This region has recently experienced large amounts of economic damages caused by high-impact hurricanes and floods. Meanwhile, drought can also pose serious risks once it occurs. By using a 2019 U.S. Gulf Coast survey combined with Standard Precipitation Index, we closely examined retrospective and prospective evaluations of drought and flood among coastal residents. Drawing upon literature on human-environment system, we were interested in how the objective conditions of past drought and flood influenced individual’s perceptions of these hazards and how their retrospective evaluations were correlated with their prospective evaluations of future trends of these hazards. Coastal residents’ retrospective evaluations of past drought and flood were found to be influenced by historic objective conditions. Higher drought frequencies were found to increase the probability of perceiving increasing trend of drought number in the past. Higher flood frequencies were found to decrease the probability of perceiving increasing trend of flood number in the past. Higher intensities of drought and flood were found to increase the probabilities of perceiving increasing trends of drought duration and flood amount in the past. Coastal residents’ prospective evaluations of future drought and flood were found to be influenced by retrospective evaluations of these hazards, suggesting the temporal continuity in human judgement. Moreover, those who relied on a longer time span in reference to the future were found to be more likely to perceive increasing trends of drought and flood. We ended this paper by proposing a theoretical framework to guide future studies and discussing policy implications." 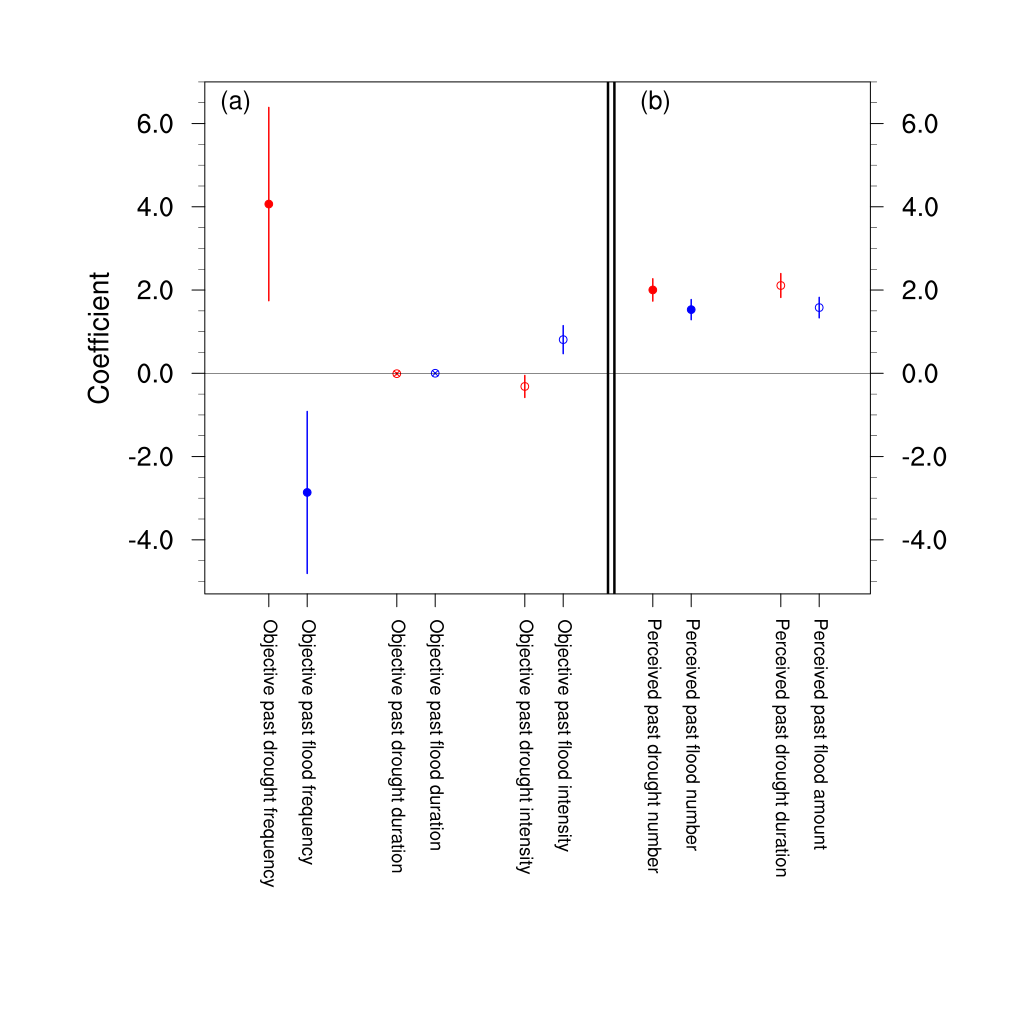 Core Figure - Figure 4. Retrospective evaluations of drought and flood risk and association with objective conditions (a) and their correlations with prospective evaluations of drought and flood risk (b). In (a), filled circles, circles with cross, empty circles depict the frequency, duration, intensity, respectively, of drought (red) and flood (blue). In (b) filled (empty) circles depict retrospective evaluations on past drought and flood numbers (past drought duration and past flood amount). The bars represent confidence intervals of all the estimated coefficients (Shao and Kam, 2020)  Graphic Abstract 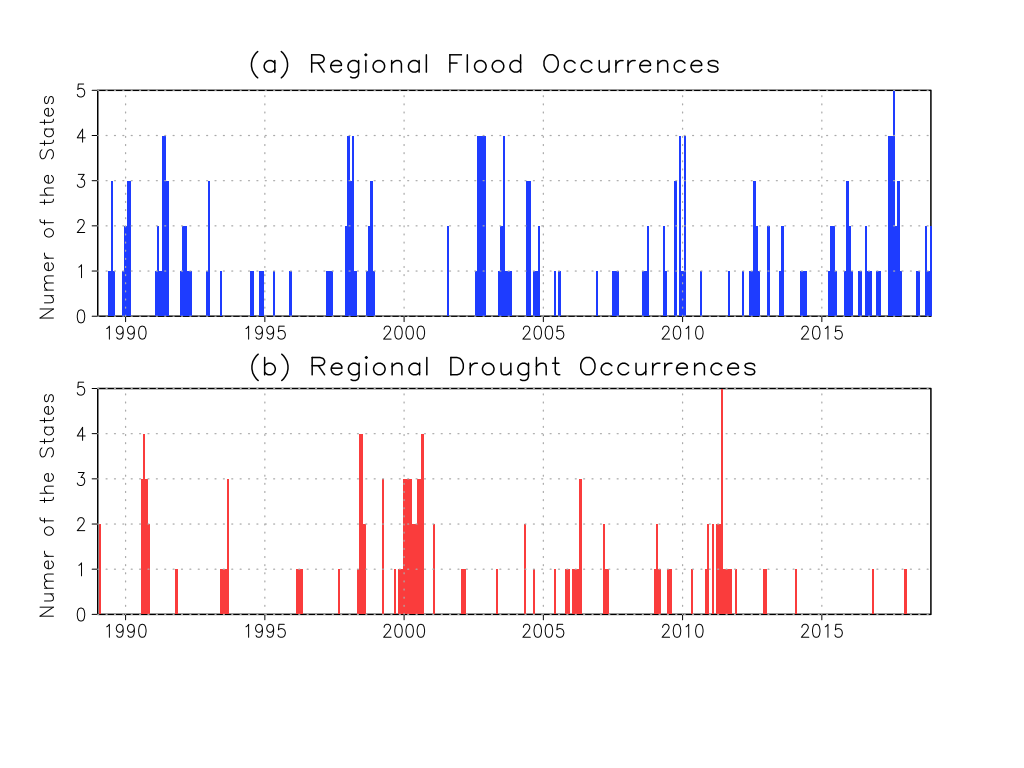 Figure 2. Number of states under regional drought events (red) and regional pluvial flood events (blue) (Shao and Kam, 2020)  Figure 3: Monthly time series of the relative search activity indices on drought (a) and flood (b) between 2004 through 2018. Dark (light) lines depict the averages (maximum and minimum values) of the relative search activity indices over the five Gulf costal states (Shao and Kam, 2020) In a new paper, we used Google Trends to reveal the spatiotemporal patterns of US drought awareness. This paper has been published in Palgrave Communications (a Nature journal, now Humanities and Social Sciences Communications). Here is more information about this paper: Article Title: Spatiotemporal Patterns of US Drought Awareness Summary: Drought is a creeping climatological phenomenon with persistent precipitation deficits. The intangible and gradual characteristics of drought cause a lack of social response during the onset. The level of awareness of a local drought increases rapidly through mass media reports and online information searching activities when the drought reaches its peak severity. This high level of local drought awareness drives concerns for water shortage and support for water policy. However, spatiotemporal patterns of national-scale drought awareness have never been studied due to constraints imposed by time-consuming and costly survey data collection and surveys' limited sample sizes. Here, we present the national-scale study to reveal the spatiotemporal patterns of drought awareness over the contiguous United States (CONUS) using Google Trends data and an advanced statistical technique, Principal Component Analysis (PCA). Results show that the first two PC modes can explain 48% (38% for PC1 and 10% for PC2; see Figures below) of the total variance of state-level drought awareness. We find that the PC1 mode relates to a national pattern of drought awareness across the CONUS. The spatiotemporal patterns further imply that residents in the Northeastern US region are the most aware of the emergence of drought, regardless of the geographic location of the occurrence. The results illustrate how search engine queries and social media data can help develop an effective and efficient plan for drought mitigation in the future. The following Figure comes from Kim et al. (2019): 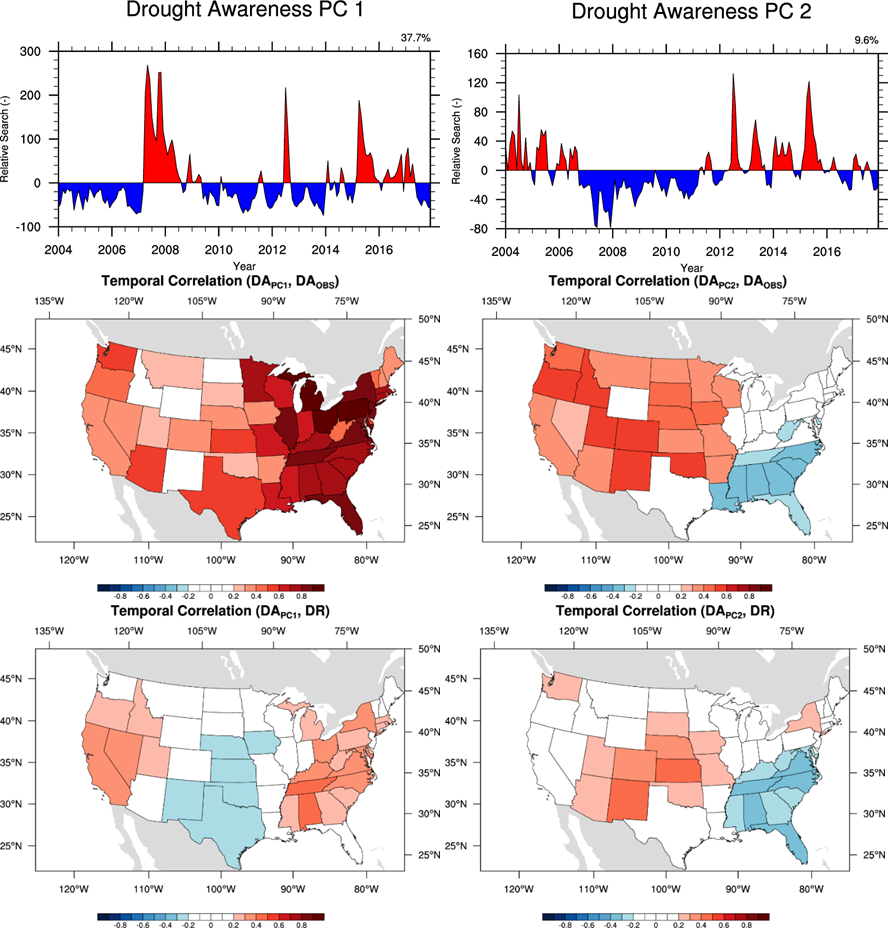 Figure 1: Major principle components of state-level drought awareness and state-level drought risk over the contiguous United States. Temporal correlations of Drought Awareness from the first two major modes with individual state-level drought awareness ((c) and (d), respectively) and individual state-level drought risk ((e) and (f), respectively). White colored states depict the states with insignificant temporal correlation at the 99% confident level. 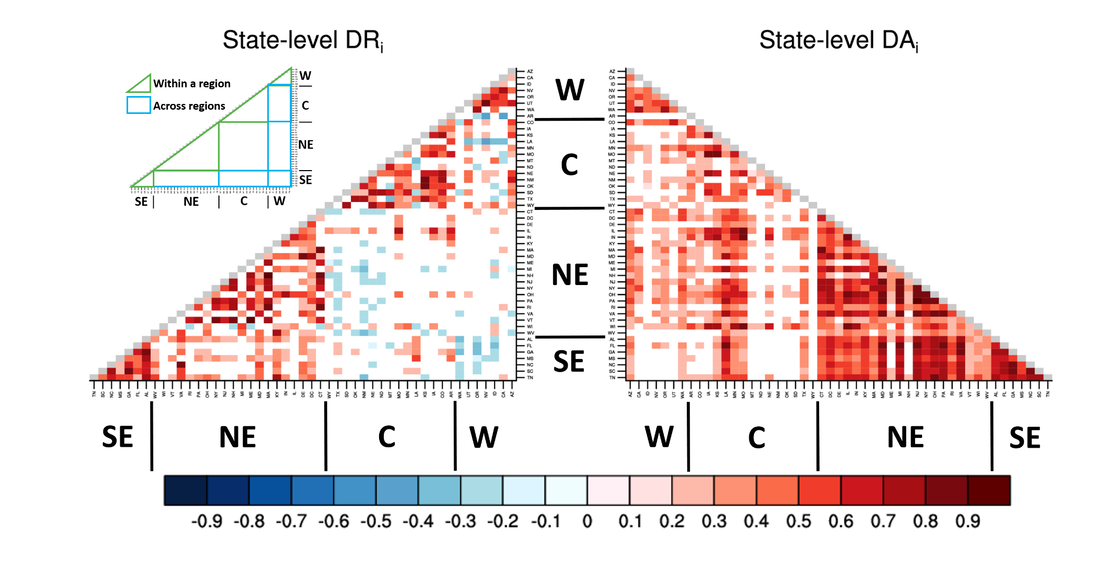 Figure 2: State-level correlation analysis of drought awareness and drought risk. Colors in the grid cells depict temporal correlation coefficients of state-level drought awareness (left triangle) and state-level drought risk (right triangle) of one state with those of the rest 48 states. To assist interpretation, areas that depict interstate relationships within the region (green colored boundaries) and across regions (blue colored boundaries) are shown in the legend box at upper-left corner.
6/28/2019 1 Comment A new paper in Disasters Our new paper was published in Disasters (impact factor: 1.797). Here is the abstract: "It is of significance to assess and depict community vulnerability to floods and hurricanes. Over the past several decades, flooding and hurricanes have affected millions of people and caused massive economic losses. Despite efforts to reduce risks, these natural hazards remain to be a considerable challenge to coastal communities. In this paper, Geographic Information Systems (GIS) methods are used to analyze coastal communities’ vulnerability to hurricanes and flooding along the U.S. Gulf coast, which is prone to these two hazards. Specifically, two types of quantitative indicators are developed: exposure to hurricanes and flooding, based on data from multiple sources such as National Climate Data Center and National Flood Insurance Program among others, and a social vulnerability index, constructed on census data at census tract level. These indices are combined to depict the spatial patterns of overall community vulnerability to flooding and hurricane hazards along the U.S. Gulf Coast. Results of this study can potentially inform disaster management agencies, county governments and municipalities of areas with heightened community vulnerabilities. The demonstration of geographic distribution of community vulnerability can assist decision makers in prioritizing to‐do items and designing policies/plans for more effective allocation of resources. We end this paper by discussing the limitations to the present study and the practical implications of the assessment." The following two figures are from this article (Shao et al. forthcoming). 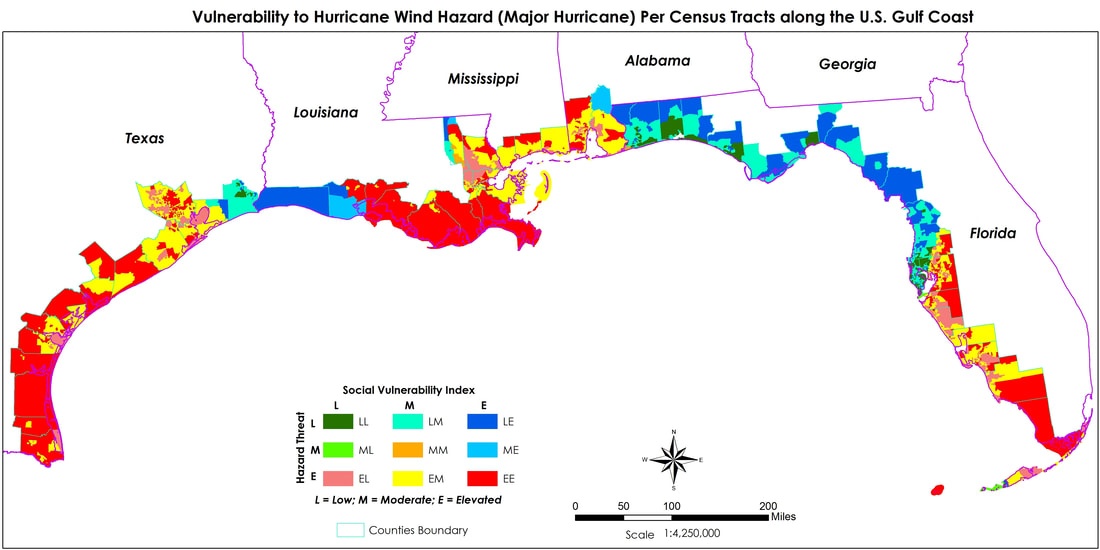 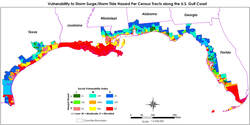
I just published one analysis article on extreme weather and American public opinion towards climate change on the Monkey Cage in Washington Post . Here is one paragraph:
"Here is what is going on: The baseline probabilities of Democrats’ and Republicans’ perceptions of climate change and extreme weather are different. To illustrate, imagine that the probability that someone in Party A believes in human-made climate change may be 80 percent, while that probability for someone in Party B may be only 30 percent. What my research finds is that extreme weather events can change that baseline probability upward, regardless of partisanship or ideology. That change may be more dramatic for those in Party A than Party B. Nevertheless, the change does occur; extreme weather can move the needle." |

|

 RSS Feed